June 10, 2025
Select an option to view the article tailored to your learning style
For those who want to dive deep into the technical details
For those who want to understand the big picture
Few minutes read that gives you the high-level points
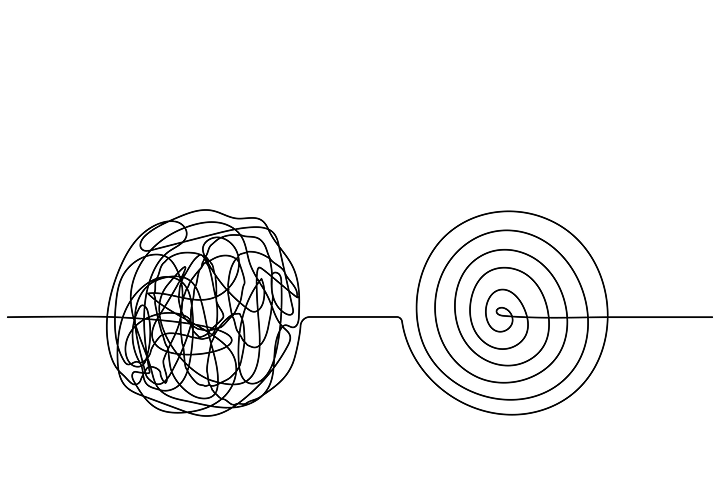
Why Dashboards Break: As more people make requests and the data changes, dashboards often turn into something messy and hard to trust.
How to Rebuild Them: Start by mapping out where the data comes from, tracing how everything connects, and getting feedback from the people who use it. Then rebuild with simplicity and clarity in mind.
What You Get: A faster, more reliable dashboard that’s easier to update, easier to understand, and more useful for everyone who depends on it.
But give them time, and they usually somehow end up there. One change here. One patch there. Suddenly, you’re looking at a tangled mess of if-statements, manual workarounds, and performance issues. What was supposed to be helpful becomes a burden. The problem gets worse once stakeholders start noticing data quality issues eroding confidence in the report.
There are a few common reasons dashboards grow increasingly complex:
The requirements evolve. The original dashboard was built for a specific need. As that need changes, more logic is added to keep it working.
You're figuring it out as you go. Sometimes the dashboard is someone’s first. You don’t know the best approach until you’ve built a few. These usually require a refactor eventually.
The logic grows unchecked. What starts as a couple of if statements turns into a web of nested expressions. In tools like Spotfire, logic can live in transformations, merges, calculated columns, and more.
Data sources change. Maybe the database schema evolves, Excel files get moved, or the source is updated regularly. Each of these changes introduces hidden complexity.
Patching is fine when changes are small and infrequent. But there are clear signs that it’s time to start fresh:
Fixing one bug breaks another
It takes longer to troubleshoot issues
No one fully understands how the dashboard works anymore
The original builder is no longer around
The dashboard is still used but now seen as a liability
If you do decide to take on a rebuild, it's important to clearly communicate to all stakeholders and leadership the expected timeline, the value of the rebuild, and the interim plan while the new one is in progress.
The time it takes to rebuild a dashboard depends heavily on its complexity. It can take anywhere from a few weeks to a few months depending on how large the report has become and how many people depend on it. Regardless of complexity, below is a phased approach we’ve found effective.
We start by understanding the relationships between tables. You can build a custom script that loops through each source and maps out which logical tables rely on which physical ones.
We can then visualize this with source tables on the X-axis, logical tables on the Y, and cell color to indicate usage frequency. This gives us a quick sense of which tables matter most. In the example below, we can see that Table 3 is probably the most important table, given the number of data sources it consumes. We also see that Source 4 is used in three different merges at different points in time. This highlights problem areas and opportunities for simplification. In this case, Table 3 becomes the prime candidate to reverse engineer first, since it’s essentially the backbone of the report. Untangling this makes the rest much easier.

We can leverage another custom script to understand how the logical tables relate to the visuals. This helps us group tabs logically and decide whether to split the dashboard into smaller, more focused ones. In the example below, we might decide that Tab 1 could be broken off into its own dashboard if it targets a different stakeholder group.

After understanding the structure, it’s time to decide what group of tabs to focus on and which core table they depend on. As mentioned, most of the dashboard’s complexity usually ties back to a single "backbone" table.
The priority decision here depends on gathering the right feedback from stakeholders. Share what you’ve learned and confirm a few things:
Are these tabs still being used?
Has the underlying workflow changed, making some tabs obsolete?
If they’re still relevant, what are the biggest pain points tied to this section?
Once we’ve prioritized the rebuild, it’s time to reverse engineer the business logic step by step. You click through the data canvas and follow each node all the way back to its original source. This includes merges, filters, calculated columns, every piece of it. As you go, rewrite that logic into a SQL query. Yes, it’s tedious, but it’s the only way to fully understand the flow and catch any hard-coded logic that might be buried deep.
This also tells us whether:
The logic can live in one large query
Or it needs to be broken into modular queries
Once that’s complete, circle back with stakeholders to walk through any assumptions or logic that need to be validated or updated. This is also the best time to start documenting what you’ve found.
Now that you’ve reverse engineered and validated the logic, it’s time to optimize.
Are we merging the same table multiple times? Can we simplify that?
Can joins be pushed earlier into the query?
Are there redundant expressions that could be centralized?
Can Excel data be moved into a database?
Should we materialize views to improve performance?
Now you rewrite the queries into their optimized form and compare the results with the old ones. Iterate a few times until the new structure is clean, accurate, and easy to maintain.
Use the new custom queries as your new data connections. These can be turned into actual SQL views once the dashboard has been validated in production.
Rebuild the visuals on top of this cleaner foundation. Avoid adding unnecessary logic inside Spotfire expressions. Centralizing logic will help prevent you from having to do another rebuild later.
You’ll notice a clear difference in complexity.
Run the same IronPython scripts from earlier to compare complexity between the old and new versions. You’ll likely see that:
The dashboard is easier to maintain and hand off
Load times improve
Business logic is centralized
Visuals are simpler and cleaner
Fixing issues is faster and more straightforward
Here are some practices we’ve picked up from doing this over the years:
Don’t create a new data connection for every table. Reuse existing data connections if they are really from the same source.
Name your data connections clearly. Don't keep them as “Microsoft SQL Connection…”
Avoid burying logic inside custom expressions and data limiting expressions. Surface those into your custom queries instead.
Keep column names aligned with source data. Moving back and forth between different casing styles just causes confusion.
If you’re copy-pasting the same logic across visuals, centralize it.
Avoid pivoting large tables in Spotfire, push that work to the database. This is one of the biggest slow downs in a report.
Be cautious with document properties, they’re hard to refactor.